Nansat: First Steps
Overview
The NANSAT package contains several classes:
Nansat - open and read satellite data
Domain - define grid for the region of interest
Figure - create raster images (PNG, TIF)
NSR - define spatial reference (SR)
Copy sample data
[1]:
import os
import shutil
import nansat
idir = os.path.join(os.path.dirname(nansat.__file__), 'tests', 'data/')
Open file with Nansat
[2]:
import matplotlib.pyplot as plt
%matplotlib inline


from nansat import Nansat
n = Nansat(idir+'gcps.tif')
Read information ABOUT the data (METADATA)
[4]:
print(n)
----------------------------------------
/opt/conda/lib/python3.7/site-packages/nansat-1.2.2-py3.7-linux-x86_64.egg/nansat/tests/data/gcps.tif----------------------------------------
Mapper: genericBand : 1 L_645
  colormap: jet
  dataType: 1
  long_name: Upward spectral radiance
  minmax: 0.000 500
  name: L_645
  short_name: nLw
  SourceBand: 1
  SourceFilename: /opt/conda/lib/python3.7/site-packages/nansat-1.2.2-py3.7-linux-x86_64.egg/nansat/tests/data/gcps.tif
  standard_name: surface_upwelling_spectral_radiance_in_air_emerging_from_sea_water
  time: 2011-08-15 10:05:00
  units: W m-2 m-1 sr-1
  wkv: surface_upwelling_spectral_radiance_in_air_emerging_from_sea_water
Band : 2 L_555
  colormap: jet
  dataType: 1
  long_name: Upward spectral radiance
  minmax: 0.000 500
  name: L_555
  short_name: nLw
  SourceBand: 2
  SourceFilename: /opt/conda/lib/python3.7/site-packages/nansat-1.2.2-py3.7-linux-x86_64.egg/nansat/tests/data/gcps.tif
  standard_name: surface_upwelling_spectral_radiance_in_air_emerging_from_sea_water
  time: 2011-08-15 10:05:00
  units: W m-2 m-1 sr-1
  wkv: surface_upwelling_spectral_radiance_in_air_emerging_from_sea_water
Band : 3 L_469
  colormap: jet
  dataType: 1
  long_name: Upward spectral radiance
  minmax: 0.000 500
  name: L_469
  short_name: nLw
  SourceBand: 3
  SourceFilename: /opt/conda/lib/python3.7/site-packages/nansat-1.2.2-py3.7-linux-x86_64.egg/nansat/tests/data/gcps.tif
  standard_name: surface_upwelling_spectral_radiance_in_air_emerging_from_sea_water
  time: 2011-08-15 10:05:00
  units: W m-2 m-1 sr-1
  wkv: surface_upwelling_spectral_radiance_in_air_emerging_from_sea_water
----------------------------------------
Domain:[200 x 200]
----------------------------------------
Projection(gcps):
GEOGCS["WGS 84",
    DATUM["WGS_1984",
        SPHEROID["WGS 84",6378137,298.257223563]],
    PRIMEM["Greenwich",0],
    UNIT["degree",0.0174532925199433]]
----------------------------------------
Corners (lon, lat):
         ( 28.25,  71.54)  ( 30.87,  71.17)
         ( 27.14,  70.72)  ( 29.68,  70.35)
Read the actual DATA
[5]:
b1 = n[1]
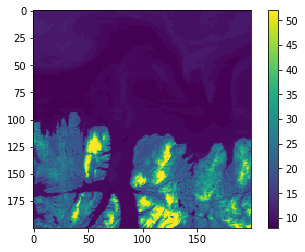
Check what kind of data we have
[6]:
%whos
plt.imshow(b1);plt.colorbar()
plt.show()
Variable   Type       Data/Info
-------------------------------
Nansat     type       <class 'nansat.nansat.Nansat'>
b1         ndarray    200x200: 40000 elems, type `uint8`, 40000 bytes
idir       str        /opt/conda/lib/python3.7/<...>64.egg/nansat/tests/data/
n          Nansat     -------------------------<...>0.72)  ( 29.68,  70.35)\n
nansat     module     <module 'nansat' from '/o<...>.egg/nansat/__init__.py'>
os         module     <module 'os' from '/opt/c<...>nda/lib/python3.7/os.py'>
plt        module     <module 'matplotlib.pyplo<...>es/matplotlib/pyplot.py'>
shutil     module     <module 'shutil' from '/o<...>lib/python3.7/shutil.py'>
Find where the image is taken
[7]:
n.write_figure('map.png', pltshow=True)
[7]:
<nansat.figure.Figure at 0x7fbc6034fda0>